
 Betuweroute en Kunst
 Kunst in huis? Netty Franssen maakt ook bijzonder mooie dingen
Use Flot with PHP or Lasso ProfessionalFlot is a pure Javascript plotting library for jQuery |
I recently had to produce some bar graphs to show our logistics performance over time. Since I code in Lasso, I give you here an example in Lasso how you can use the open source Flot jQuery library. The fields and recordset names in the code examples are of course only relevant to me, also qua data, but it shows how to implement a horizontal time scale in Flot and hopefully gives someone the 'Aha'-moment that I need so often when looking for a solution.
Update: since 2017 I switched from Lasso to PHP.
I updated the page and added PHP code as well.
Tweet

1. Identify the server your page runs on:
Since I use an external host for all media, I have a page variable stored with the domain name, so that when the domain changes, I only have to change it in the code on one place. So somewhere I did:
Lasso:
[
var('zzHost' = 'assets.example.com');
if(mv_server == 'DEV');
var('zzHost' = 'localhost/media');
/if;
]
PHP:
<?php
$zzHost = 'assets.example.com';
if (substr(mv_server(), 0, 3) == 'DEV')
{
$zzHost = 'localhost/media';
}
?>
mv_server is a small piece of Lasso code, in LassoSatrtup, which I implement on every server. On every server I edit the file and put the name in I want to use for that server. That way, IP’s can change, everything can change, for my Lasso code it is still the same server. The following code runs on three Macs, all used for development:
Lasso:
<?lassoscript
// Return logical name of server.
// Alter this name on all servers.
define_tag('mv_server');
return('DEV');
/define_Tag;
?>
PHP:
<?php
// Return logical name of server.
// Alter this name on all servers.
function mv_server()
{
return('DEV');
}
?>
2. Then you need to include some Javascript libraries.
Build a Lasso string with all script statements. That way you avoid Lasso errors with [ and ] inside the normal javascript code, and at the same time include the host from variable zzhost:
Lasso:
[
var('jslibs' = '<!--[if IE]><script language="javascript" type="text/javascript" src="http://' + $zzHost + '/js/flot/excanvas.min.js"></script><![endif]-->
<script language="javascript" type="text/javascript" src="http://' + $zzHost + '/js/flot/jquery.flot.js"></script>
<script language="javascript" type="text/javascript" src="http://' + $zzHost + '/js/flot/jquery.flot.stack.js"></script>'
);
]
PHP:
<?php
$jslibs = '<!--[if IE]><script language="javascript" type="text/javascript" src="http://' . $zzHost . '/js/flot/excanvas.min.js"></script><![endif]-->
<script language="javascript" type="text/javascript" src="http://' . $zzHost . '/js/flot/jquery.flot.js"></script>
<script language="javascript" type="text/javascript" src="http://' . $zzHost . '/js/flot/jquery.flot.stack.js"></script>';
?>
Output the statements in <head> section, so they appear in the final page:
Lasso:
[$jslibs;]
PHP:
<?=$jslibs?>
3. Now collect some data.
Lasso:
[
// Get numbers on time / not on time per day
var('zzsql' = "
select exdate, count(*) as zznum, 'Y' as zzontime
from db.table where a = 1 and b = x
group by exdate, zzontime
union all
select exdate, count(*) as zznum, ’N’ as zzontime
from db.table where a = 0 or c = z
group by exdate, zzontime
");
// Execute query and store record set
var('zzNumRecs' = 0);
inline(-inlinename='i_ontime', -sql=$zzsql, -maxrecords='All');
var('zzNumRecs' = found_count);
/inline;
]
PHP:
<?php
// Get numbers on time / not on time per day
$zzsql = "
select exdate, count(*) as zznum, 'Y' as zzontime
from db.table where a = 1 and b = x
group by exdate, zzontime
union all
select exdate, count(*) as zznum, ’N’ as zzontime
from db.table where a = 0 or c = z
group by exdate, zzontime
";
// Execute query and store record set
$rs_ontime = fw_execSQL_array($zzsql); // Function that executes mysqli and returns the record set as an array
$zzNumRecs = $rs_ontime[0];
?>
4. Set the parameters for the graph to plot.
The data in this example may contain 1 or 2 values for each day.
Lasso:
[
var('zzPlotstring' = '
[
{data:myData, label:"On time"},
{data:myData2, label:"Delayed"}
],
{
series: {
stack:true,
bars:{
show:true,
barWidth: 86400000
}
},
legend: {
show:true,
position:"nw",
backgroundOpacity:0
},
xaxis: {
mode:"time",
timeformat:"%d.%m.%y"
},
colors: [
"#00dd00",
"#ff0000"
]
}’);
]
PHP:
<?php
$zzPlotstring = '
[
{data:myData, label:"On time"},
{data:myData2, label:"Delayed"}
],
{
series: {
stack:true,
bars:{
show:true,
barWidth: 86400000
}
},
legend: {
show:true,
position:"nw",
backgroundOpacity:0
},
xaxis: {
mode:"time",
timeformat:"%d.%m.%y"
},
colors: [
"#00dd00",
"#ff0000"
]
}’;
?>
A short explanation for unobvious things:
stack:true means we can stack bars on top of each other.
barWidth:86400000 in this example, the width of a bar must be one day. Since a time line is in milliseconds, the width has to be in milliseconds too! Thus, one day is 24hrs * 60min * 60sec * 1000 milliseconds.
position:"nw" is north-west, i.e. top left corner of the graph.
colors: is an array with a color for each data set, specified at the top with data:
5. Prepare a DOM element to contain the graph.
The width of the element depends on the number of rows found in the previous query.
Lasso:
<div id="ontimechart" style="width:[($zzNumRecs > 100 ? 1000 | 500)]px; height:200px; display:visible;"></div>
PHP:
<div id="ontimechart" style="width:<?=($zzNumRecs > 100 ? 1000 : 500)?>px; height:200px; display:visible;"></div>
6. Add all jQuery and Flot code and the end of the page
Since I need Lasso to parse the Javascript code, I do not use [protect][/protect] or comments around the Javascript!
To build a sensible graph based on a horizontal time scale, Flot uses dates in milliseconds since 1.1.1970. This can be accomplished in Lasso with the date_difference tag, since the date tag has no milliseconds member tag.
6.1. Build the data sets
The output may look like this:
var myData = [[1288656000000,1],[1288915200000,1],[1289174400000,2],[1289433600000,1],[1290038400000,1],[1290470400000,1],[1290556800000,2]]
where the first element of each pair is the x-axis (the date) value and the second value is the y-axis value (the number on-time).
The Lasso / PHP code below writes the output directly into it’s page buffer, so the javascript is written 'on the fly'.
Lasso:
<script language="Javascript">
$(document).ready(function(){
/*
Build the data set for on-time records
*/
var myData = ["[";
var('zzpushed'=0);
records(-inlinename='i_ontime');
if(field('zzontime')=='Y');
if($zzpushed==1);',';/if; // add a comma if array-element 1 has been output.
"[";date_difference(field('exdate'), date('19700101'), -millisecond);",";field('zznum');']';
$zzpushed=1;
/if;
/records;
"]"];
/*
Build the data set for not on-time records
*/
var myData2 = ["[";
var('zzpushed'=0);
records(-inlinename='i_ontime');
if(field('zzontime')=='N');
if($zzpushed==1);',';/if; // add a comma if array-element 1 has been output.
"[";date_difference(field('exdate'), date('19700101'), -millisecond);",";field('zznum');']';
$zzpushed=1;
/if;
/records;
"]"];
/*
And then plot the graph.
Flot will take care of stacking the two datasets and adding missing dates in between. Very cool!
*/
$.plot($("#ontimechart"), [$zzPlotstring]);
}
PHP:
<script language="Javascript">
$(document).ready(function(){
/*
Build the data set for on-time records
*/
<?php
$myData = '';
$zzpushed = 0;
foreach ($rs_ontime as $row => $field)
{
if ($field['zzontime'] == 'Y')
{
$myData .= ($zzpushed == 1 ? ',[' : '['); // add a comma if array-element 1 has been output.
$interval = date_diff(date_create($field['exdate'], date_create('19700101'));
$myData .= $interval->format('%v'); // milliseconds (PHP 7+ needed)
$myData .= ',' . $field['zznum'] . ']');
$zzpushed = 1;
}
}
/*
Build the data set for not on-time records
*/
$myData2 = '';
$zzpushed = 0;
foreach ($rs_ontime as $row => $field)
{
if ($field['zzontime'] == 'N')
{
$myData2 .= ($zzpushed == 1 ? ',[' : '['); // add a comma if array-element 1 has been output.
$interval = date_diff(date_create($field['exdate'], date_create('19700101'));
$myData2 .= $interval->format('%v'); // milliseconds (PHP 7+ needed)
$myData2 .= ',' . $field['zznum'] . ']');
$zzpushed = 1;
}
};
?>
var myData = "[<?=$myData?>]";
var myData2 = "[<?=$myData2?>]";
/*
And then plot the graph.
Flot will take care of stacking the two datasets and adding missing dates in between. Very cool!
*/
$.plot($("#ontimechart"), "<?=$zzPlotstring?>");
}
That’s it. The graph then might look like this:
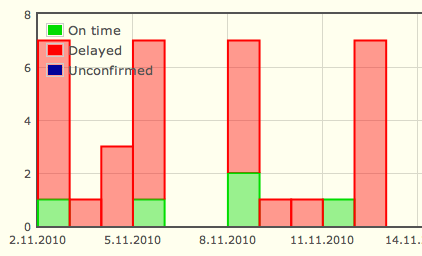
In the image you see a third data set (myData3), which I left out in the example code.